The Aditya Birla Group, as an unique experiment and leap of faith opted for SustLabs Ohm for Business B2B Solution to help monitor usage at the cafeteria at the Worli, Mumbai facility. Here the facility is managed by CBRE India and in turn the cafeteria services are managed by sub-vendor Sodexho.
Initially, cafeteria energy requirements were met 100% through fossil fuels including Liquefied Petroleum Gas (LPG) and Piped Natural Gas (PNG). During the pandemic, with physical attendance down, renovation of the cafeteria allowed a 40% migration from 100% gas to 60% gas, and 40% electricity.
The fossil fuel charges could be directly managed by the vendor. However with the introduction of electrical devices, there was the requirement to measure the electricity and determine the consumption, since this overhead was billed by the utility to the main company & coordinated by the facility management team.
The Ohm for Business solution was deployed to monitor the top 4 unique heavy kitchen equipment including Combi Oven (18.6 kW), Induction Single Range (12 kW), Induction Tilting Braising Pan (15 kW) & Induction Round Fryer (15 kW).
The solution has been immensely useful to monitor specific equipment, and the client is delighted with the accurate data that is provided. This has helped in computing the power charges billable to the vendor. Further, with the live dashboard and day wise hourly consumption reports, the pattern of consumption can be monitored in real time, and this very useful to audit usage, reduce unwanted usage and gain insights on ways to streamline processes.
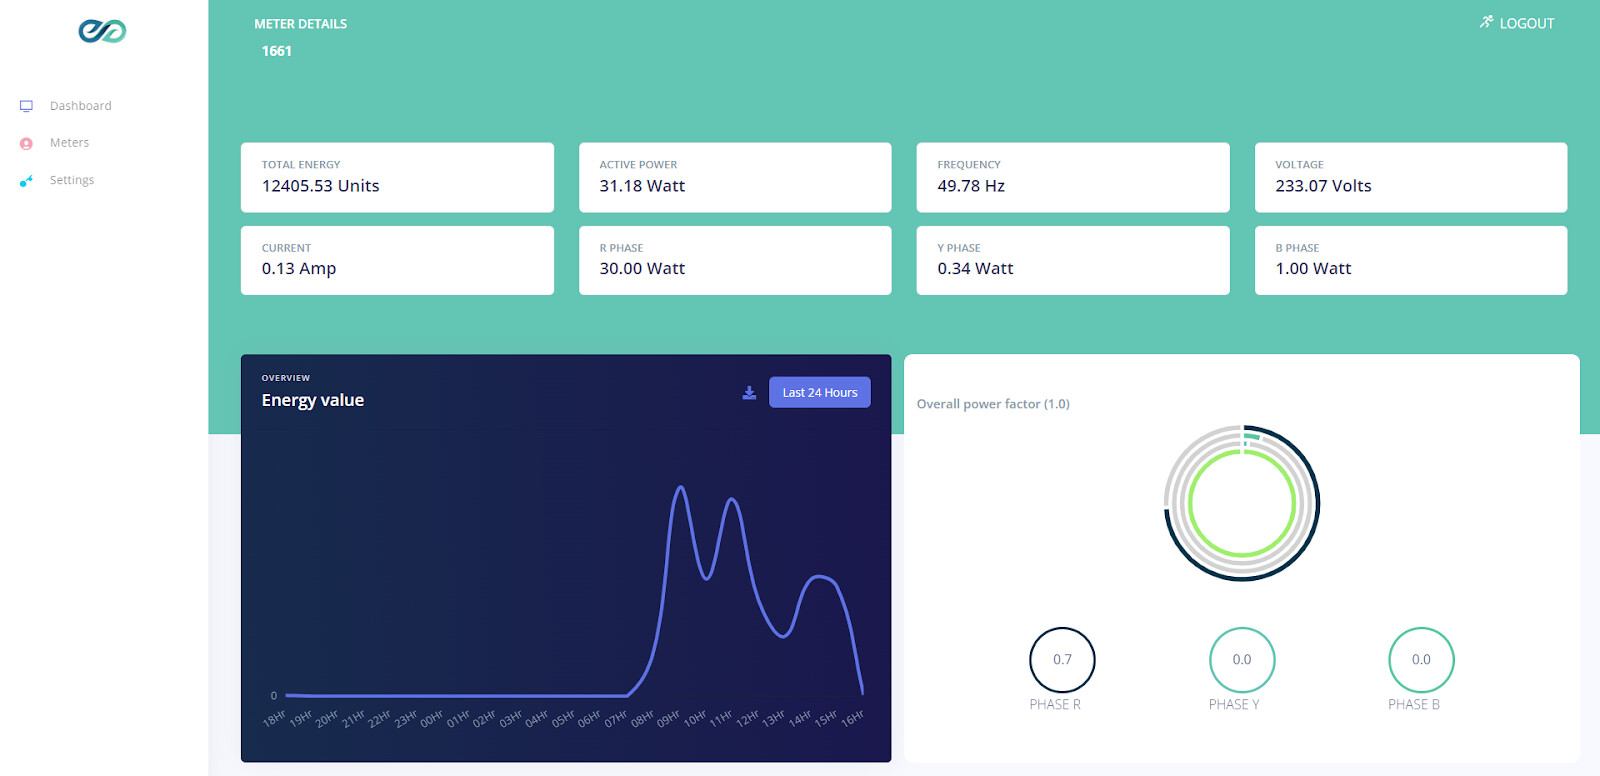
Ohm for Business is accessible via Web based CRM dashboard using an easy-to-understand interface, for both management & ground executives positioned as a real time auditing tool.
Daily tracking of consumption through the real time dashboard to trace & pinpoint over usage for particular days and time of the day. Multiple meters displayed at a glance, and screens for individual meters can be accessed.

For each meter, LIVE information for the following parameters can be viewed: TOTAL ENERGY (Units), ACTIVE POWER (Watts), FREQUENCY (Hz), VOLTAGE (Volts), CURRENT (Amps), R PHASE POWER (Watts), Y PHASE POWER (Watts) & B PHASE POWER (Watts).
Hence unbalanced phase wise loads can be observed. Also, overall & phase-wise Power Factor information is available, and when the PF goes below 0.9, users can take appropriate action for the phases with low PF.
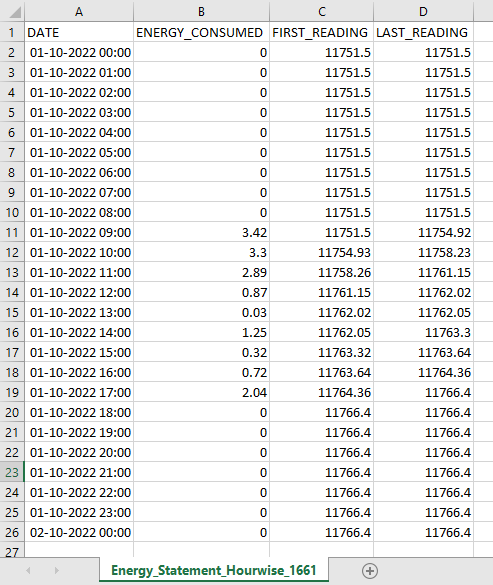
Energy Statement can be generated via email spanning multiple days. Summary statement (units consumed in period) in mail & detailed statement CSV file with hour-wise energy consumption for offline analysis, including Date/Time, Energy Consumed, First Reading & Last Reading.
Daily Reports provide the below information for the previous day, direct to the email box.
Performance Details includes Max Power (W), Mean Power (W) & Total Energy (KWhr)
Report Details include Start Time, End Time & System Uptime (%)
Total Energy Consumption (Hourwise) in Watts in Graphical Format.